
Langley is the Fraser Valley market where 2026 started too high and then came back down. January sale listings had a $1,198,000 median. February was already $839,900. Most later months lived in the $830,000 to $980,000 range. The 2025 median of $1,190,000 versus the 2026 median of $889,000 tells the same story in two numbers.
Current listings have recovered a little, at $974,950, with 48.2% still asking $1 million or more. Langley got cheaper than January. It did not become an inexpensive city.
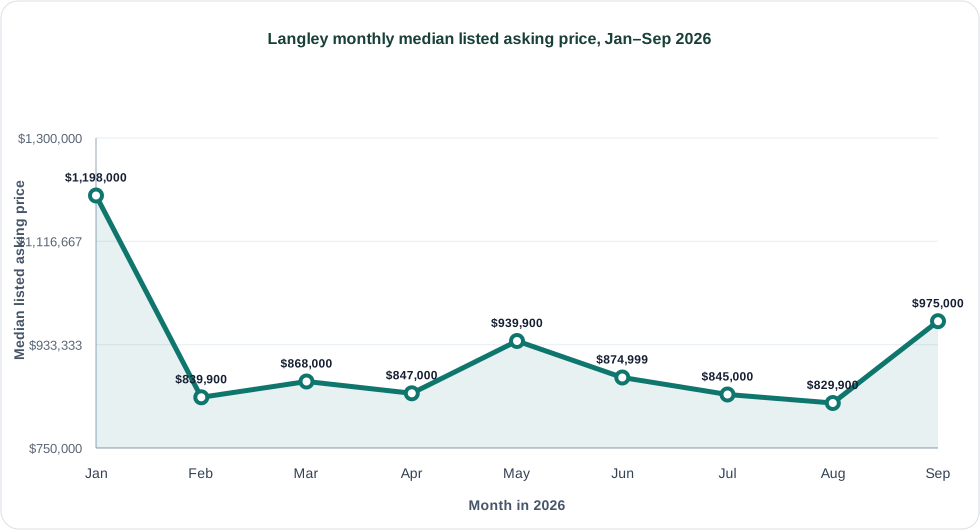
Langley monthly median listed asking price:
| Month | Sale listings | Median listed asking price |
|---|---|---|
| January 2026 | 271 | $1,198,000 |
| February 2026 | 347 | $839,900 |
| March 2026 | 590 | $868,000 |
| April 2026 | 650 | $847,000 |
| May 2026 | 578 | $939,900 |
| June 2026 | 589 | $874,999 |
| July 2026 | 535 | $845,000 |
| August 2026 | 449 | $829,900 |
| September 2026 (partial) | 351 | $975,000 |
The reset did not erase the detached premium. June through mid-September condos had a $499,998 median. Townhomes were $814,900. Detached homes were $1,599,000. A buyer who “waited for Langley to come down” waited for the citywide mix to change, not for detached homes to become condos.
| June–September 2026 home type | Sale listings | Median listed asking price |
|---|---|---|
| Condo/apartment | 554 | $499,998 |
| Townhome | 445 | $814,900 |
| Detached | 727 | $1,599,000 |
January and February are the months that confuse Langley shoppers. $1,198,000 then $839,900 is not a $358,000 overnight markdown on the same house. January had 271 sale listings. February had 347, with a cheaper mix. Mid-September’s $975,000 is closer to the current $974,950 live median than either winter extreme. If you bookmarked January as “the real Langley,” you bookmarked the expensive opening, not the year.
The detached median of $1,599,000 is why the Fraser Valley still feels expensive after the citywide reset. Condos at $499,998 are the product that actually came down into a more reachable band. Surrey, next door, is the bedroom-count version of a million-dollar step-up. Read the Surrey report and the Maple Ridge report before you treat one Fraser Valley headline as the whole valley.
See Langley homes for sale, compare Surrey and Maple Ridge, or check Market Trends.
The Casakibo Data Labs prepare market reports using structured Canadian real estate listing data, city-level comparisons, and property-type checks. This report was prepared by the Casakibo Data Labs using residential sale listings from participating Canadian real estate boards and CREA member feeds, covering January 1, 2026 through September 17, 2026. September is a partial month. For data questions, market research, or partnership inquiries, contact Casakibo.