

North Vancouver had a higher 2025 than 2026, and 2026 is still not cheap. Sale listings from 2025 had a $1,348,500 median. In 2026 through mid-September it was $1,299,000. Current listings are $1,298,000, and 61.8% ask $1 million or more.
That is a modest cooldown, not a reset. The monthly 2026 medians stayed in a high band rather than collapsing toward the condo-only number. North Vancouver remains a market where the typical listing is a million-dollar listing.
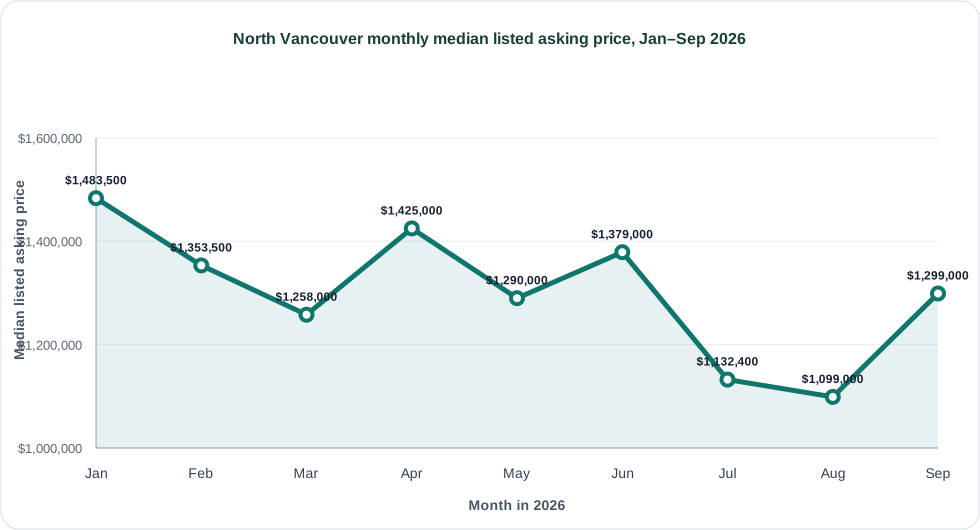
North Vancouver monthly median listed asking price:
| Month | Sale listings | Median listed asking price |
|---|---|---|
| January 2026 | 166 | $1,483,500 |
| February 2026 | 236 | $1,353,500 |
| March 2026 | 431 | $1,258,000 |
| April 2026 | 547 | $1,425,000 |
| May 2026 | 553 | $1,290,000 |
| June 2026 | 425 | $1,379,000 |
| July 2026 | 374 | $1,132,400 |
| August 2026 | 280 | $1,099,000 |
| September 2026 (partial) | 327 | $1,299,000 |
Condos are the pressure valve. June through mid-September condo/apartment listings had a $769,000 median. Townhomes were $1,299,900. Detached homes were $2,198,000. The 2025-to-2026 cooldown happened at the citywide level; the detached premium did not disappear.
| June–September 2026 home type | Sale listings | Median listed asking price |
|---|---|---|
| Condo/apartment | 632 | $769,000 |
| Townhome | 231 | $1,299,900 |
| Detached | 443 | $2,198,000 |
July and August were the cheapest months of 2026, at $1,132,400 and $1,099,000. Mid-September returned to $1,299,000, matching the 2026 listing-year median. That late-summer dip is the closest North Vancouver came to looking “softer,” and it still printed as a million-dollar month. Do not build a bid strategy on August alone. The fall listings that followed came back to the yearly centre.
The 2025 median of $1,348,500 versus 2026’s $1,299,000 is a modest cooldown, not a Metro Vancouver reset. Vancouver itself cooled more in the yearly median. Burnaby’s headline is lower because it is more condo-weighted. North Vancouver stayed a million-dollar typical listing. Compare current North Vancouver homes for sale with the Vancouver report if you are trying to decide whether the North Shore discount is real.
Browse North Vancouver homes for sale, compare Vancouver and Burnaby, or continue in the Market Research Blog.
The Casakibo Data Labs prepare market reports using structured Canadian real estate listing data, city-level comparisons, and property-type checks. This report was prepared by the Casakibo Data Labs using residential sale listings from participating Canadian real estate boards and CREA member feeds, covering January 1, 2026 through September 17, 2026. September is a partial month. For data questions, market research, or partnership inquiries, contact Casakibo.