
Metro Vancouver condo and apartment rentals stayed expensive through the first seven months of 2026, but the market did not move in a straight line. Based on Casakibo residential lease listing data for apartment-style rentals entered from January 1, 2026 through July 31, 2026, this Metro Vancouver sample includes 2,080 condo and apartment-style rental listings across Vancouver, Burnaby, Surrey, Richmond, Coquitlam, North Vancouver, Langley, New Westminster, West Vancouver, Maple Ridge, Port Moody, White Rock, and Port Coquitlam.
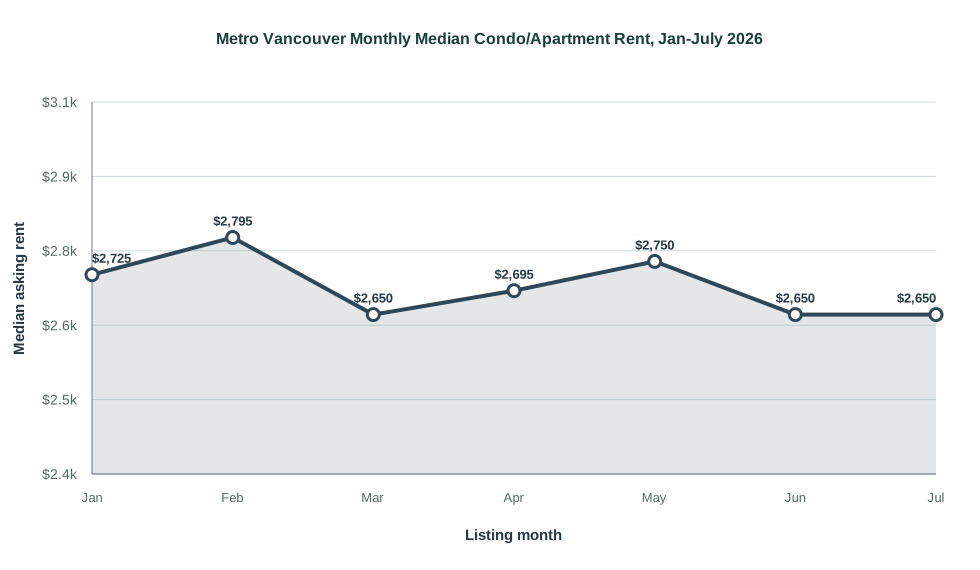
Because rental markets are seasonal, this report does not use one pooled January-July median as the main benchmark. The better view is a monthly panel. The Metro Vancouver median was $2,725 in January, rose to $2,795 in February, then settled into a narrower $2,650-$2,750 range from March through July. July closed at a $2,650 median across 421 listings.
Metro Vancouver condo and apartment rental listings by listing entry month:
The size split shows a clear premium for larger apartment-style rentals. One-bedroom medians moved between $2,150 and $2,473 during the January-July period, while two-bedroom medians stayed much higher, mostly around $2,900 to $3,100. Three-bedroom condo and apartment rentals were less common and more volatile, with monthly medians from $3,850 to $4,670 where the monthly sample was large enough to show.
Metro Vancouver condo and apartment median rents by size and listing entry month:
| Listing Entry Month | Studio | 1 Bed | 2 Bed | 3 Bed |
|---|---|---|---|---|
| January 2026 | n/a | $2,400 | $3,100 | n/a |
| February 2026 | n/a | $2,473 | $2,950 | $3,850 |
| March 2026 | $2,100 | $2,293 | $3,100 | $4,500 |
| April 2026 | n/a | $2,300 | $3,000 | $4,400 |
| May 2026 | $2,050 | $2,380 | $3,000 | $4,670 |
| June 2026 | $1,900 | $2,150 | $2,950 | $3,850 |
| July 2026 | $1,800 | $2,280 | $2,900 | $4,150 |
Vancouver was the deepest market in the sample by a wide margin, with 911 listings from January through July. Burnaby followed with 278 listings, Surrey had 240, Richmond had 163, Coquitlam had 133, and North Vancouver had 101. West Vancouver, Maple Ridge, Port Moody, White Rock, and Port Coquitlam add useful context around the core Metro Vancouver rental market, especially when they appear in recent full-month snapshots.
The monthly city panel shows how different the region can be. Vancouver moved from a $3,195 median in January to $3,050 in July, with a June high of $3,400. Burnaby moved from $2,525 in March to $2,400 in July after reaching $2,750 in May. Surrey moved from $1,875 in February to $2,200 in July, remaining meaningfully below Vancouver, Burnaby, Richmond, and North Vancouver. Richmond moved from $2,500 in March to $2,750 in July.
Selected Metro Vancouver condo and apartment city medians by listing entry month:
| Area | Jan 2026 | Feb 2026 | Mar 2026 | Apr 2026 | May 2026 | Jun 2026 | Jul 2026 |
|---|---|---|---|---|---|---|---|
| Vancouver | $3,195 | $3,000 | $3,200 | $3,175 | $3,200 | $3,400 | $3,050 |
| Burnaby | n/a | n/a | $2,525 | $2,425 | $2,750 | $2,600 | $2,400 |
| Surrey | n/a | $1,875 | $1,900 | $2,000 | $2,188 | $2,000 | $2,200 |
| Richmond | n/a | n/a | $2,500 | $2,650 | $2,600 | $2,780 | $2,750 |
| Coquitlam | n/a | $2,600 | $2,550 | $2,600 | $2,300 | $2,400 | $2,250 |
| North Vancouver | n/a | n/a | $3,625 | $2,975 | $3,200 | $3,250 | $2,950 |
| Langley | n/a | n/a | $1,900 | $2,200 | $2,300 | $2,099 | $2,088 |
| New Westminster | n/a | n/a | $2,700 | $2,900 | $2,400 | n/a | $2,200 |
July is the cleanest recent full-month snapshot in this draft. Looking only at July 2026, Vancouver had a $2,600 median for one-bedroom apartment-style rentals and a $3,700 median for two-bedroom rentals. Burnaby was lower at $2,250 for one-bedroom units and $2,900 for two-bedroom units. Surrey remained the lower-cost large market in the sample, with a $1,780 median for one-bedroom units and $2,400 for two-bedroom units.
Selected city-by-size medians for condo and apartment rentals, July 2026 only:
| Area | Studio | 1 Bed | 2 Bed | 3 Bed |
|---|---|---|---|---|
| Vancouver | $1,800 | $2,600 | $3,700 | $4,800 |
| Burnaby | n/a | $2,250 | $2,900 | $3,800 |
| Surrey | n/a | $1,780 | $2,400 | n/a |
| Richmond | n/a | n/a | $2,750 | n/a |
| Coquitlam | n/a | $2,023 | $2,650 | n/a |
| North Vancouver | n/a | $2,565 | $4,275 | n/a |
| Langley | n/a | $1,725 | $2,525 | n/a |
| New Westminster | n/a | $2,075 | $2,500 | n/a |
| White Rock | n/a | $2,795 | $3,200 | n/a |
For renters, the main lesson is that Metro Vancouver pricing is highly location-sensitive. Vancouver and North Vancouver sit in a different rental band from Surrey, Langley, and parts of Coquitlam. Burnaby, Richmond, and New Westminster can sit between those poles depending on building quality, transit access, unit size, and the month in which the listing enters the market.
For landlords and realtors, the data points to careful comparable selection. A two-bedroom apartment in Vancouver is not priced against the same renter pool as a two-bedroom in Surrey or Langley. Even within the same city, a downtown condo, a transit-oriented high-rise, and an older rental apartment can move differently. The safest benchmark is filtered by city, month, property type, bedroom count, building age, parking, amenities, and recent listing activity.
Explore current rental listings related to this market report on Casakibo: Vancouver rentals, Burnaby rentals, Surrey rentals
Compare live Canadian real estate listings from the Casakibo homepage.
Research local home-value context with Casakibo Home Worth.
The Casakibo Data Labs prepare rental-market research using structured listing data, city-level comparisons, and property-type market checks. This report was prepared by the Casakibo Data Labs using thousands of active residential lease listings from participating Canadian real estate boards and CREA member feeds. For data questions, market research, or partnership inquiries, contact Casakibo.