
Condo and apartment rentals across the Greater Toronto Area have been active through 2026, but the market has not moved in one simple direction. Some cities have pushed higher, some have held close to flat, and a few suburban apartment markets softened during parts of the year. Because rent is seasonal, this report avoids using one blended January-to-August median as the main pricing benchmark. Instead, the analysis is shown month by month.
Based on Casakibo residential lease listing data for apartment-style rentals entered from January 1, 2026 through August 1, 2026, the GTA condo and apartment sample includes 36,421 listings across Toronto and surrounding GTA communities. This report focuses only on apartment-style and condo-style residential rentals. It excludes house-oriented rental formats so Toronto, Mississauga, Oakville, Vaughan, Markham, Burlington, Brampton, Pickering, Oshawa, Clarington, and other GTA areas can be compared more consistently. Listing information comes from participating real estate boards, CREA member feeds, and Casakibo listing data.
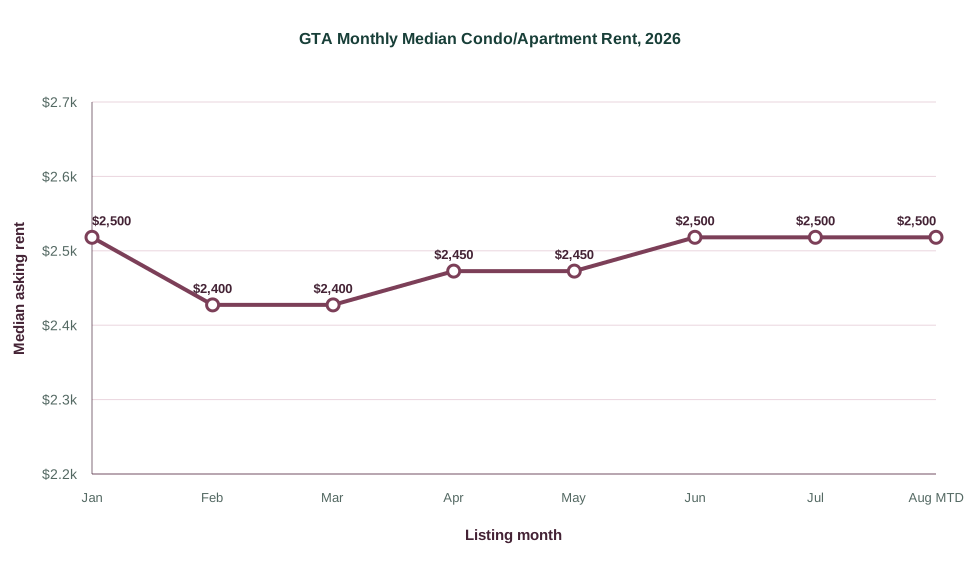
The monthly pattern shows why a time series is better than one combined figure. January and February already had meaningful listing flow: January had 824 listings and February had 1,891. The median was $2,500 in January, moved to $2,400 in February and March, returned to $2,450 in April and May, then reached $2,500 in June and July. August is month-to-date only and should be read cautiously.
GTA condo and apartment rental listings by listing entry month:
The size split also needs to be read month by month. A one-bedroom rent in January is not the same market moment as a one-bedroom rent in July. In the monthly panel below, the strongest seasonal lift is visible in two-bedroom and larger apartment-style rentals. Two-bedroom medians moved from $2,500 in February and March to $2,650 in July. Three-bedroom medians moved from $3,000 in February to $3,300 in June and July. Studio rents were steadier, staying close to $1,850-$1,900.
GTA condo and apartment median rents by size and listing entry month:
| Listing Entry Month | Studio | 1 Bed | 2 Bed | 3 Bed | 4+ Bed |
|---|---|---|---|---|---|
| January 2026 | $1,850 | $2,150 | $2,600 | $3,300 | n/a |
| February 2026 | $1,895 | $2,150 | $2,500 | $3,000 | $3,600 |
| March 2026 | $1,850 | $2,150 | $2,500 | $3,200 | $3,600 |
| April 2026 | $1,850 | $2,150 | $2,550 | $3,150 | $4,400 |
| May 2026 | $1,850 | $2,175 | $2,590 | $3,200 | $4,050 |
| June 2026 | $1,900 | $2,200 | $2,600 | $3,300 | $3,850 |
| July 2026 | $1,900 | $2,200 | $2,650 | $3,300 | $4,500 |
| August 2026 month-to-date | n/a | $2,225 | $2,699 | $3,200 | n/a |
City performance also looks different when shown as a monthly panel. Toronto stayed near the top of the inventory stack throughout the year, but its median changed from $2,500 in January to $2,550 in July and $2,500 in early August. Mississauga stayed near $2,500 through most of the year, while Vaughan moved from $2,300 in January to $2,375 in July. Markham held around $2,400 for much of the spring and reached $2,425 in June and July.
Selected GTA condo and apartment city medians by listing entry month:
| Area | Jan 2026 | Feb 2026 | Mar 2026 | Apr 2026 | May 2026 | Jun 2026 | Jul 2026 | Aug 2026 MTD |
|---|---|---|---|---|---|---|---|---|
| Toronto | $2,500 | $2,450 | $2,450 | $2,490 | $2,450 | $2,500 | $2,550 | $2,500 |
| Mississauga | $2,500 | $2,499 | $2,400 | $2,500 | $2,500 | $2,500 | $2,500 | $2,650 |
| Vaughan | $2,300 | $2,300 | $2,300 | $2,300 | $2,350 | $2,400 | $2,375 | n/a |
| Markham | $2,400 | $2,400 | $2,350 | $2,400 | $2,400 | $2,425 | $2,425 | $2,680 |
| Oakville | $2,400 | $2,300 | $2,300 | $2,300 | $2,375 | $2,350 | $2,350 | n/a |
| Burlington | $2,350 | $2,300 | $2,400 | $2,300 | $2,300 | $2,300 | $2,300 | n/a |
| Richmond Hill | $2,625 | $2,330 | $2,400 | $2,400 | $2,400 | $2,400 | $2,490 | n/a |
| Brampton | $2,300 | $2,200 | $2,300 | $2,399 | $2,300 | $2,300 | $2,400 | n/a |
| Milton | n/a | $2,200 | $2,175 | $2,200 | $2,275 | $2,450 | $2,293 | n/a |
| Pickering | n/a | $1,925 | $2,200 | $2,375 | $2,450 | $2,400 | $2,350 | n/a |
| Oshawa | n/a | $2,195 | $1,875 | $2,000 | $1,950 | $2,000 | $1,880 | n/a |
| Clarington | n/a | $2,100 | $1,950 | $2,000 | $2,000 | $2,000 | $2,200 | n/a |
July is the cleanest recent full-month snapshot in this dataset. Looking only at July 2026 avoids mixing winter, spring, and summer conditions. In July, Toronto two-bedroom condo and apartment rentals had a $2,700 median, while Mississauga was $2,550, Vaughan was $2,500, Oakville was $2,450, and Oshawa was $2,200. For three-bedroom apartment-style rentals, Toronto was materially higher at $3,500, compared with $2,950 in Mississauga and $3,175 in Markham.
Selected city-by-size medians for condo and apartment rentals, July 2026 only:
| Area | Studio | 1 Bed | 2 Bed | 3 Bed | 4+ Bed |
|---|---|---|---|---|---|
| Toronto | $1,925 | $2,250 | $2,700 | $3,500 | $4,698 |
| Mississauga | n/a | $2,200 | $2,550 | $2,950 | n/a |
| Vaughan | $1,750 | $2,100 | $2,500 | $3,100 | n/a |
| Markham | n/a | $2,200 | $2,450 | $3,175 | n/a |
| Oakville | n/a | $2,100 | $2,450 | $3,000 | n/a |
| Burlington | n/a | $2,200 | $2,600 | n/a | n/a |
| Richmond Hill | n/a | $2,190 | $2,550 | $3,100 | n/a |
| Brampton | n/a | $2,200 | $2,400 | n/a | n/a |
| Milton | n/a | $2,050 | $2,300 | n/a | n/a |
| Pickering | n/a | $2,100 | $2,399 | n/a | n/a |
| Oshawa | $1,525 | $1,880 | $2,200 | n/a | n/a |
| Clarington | n/a | n/a | $2,200 | n/a | n/a |
Among cities with consistent monthly listing flow, Pickering showed the strongest measured increase in 2026, moving from a $1,925 median in February to $2,350 in July, a 22.1% rise. That does not mean every Pickering condo became 22% more expensive. It means the median of apartment-style rental listings in the measured monthly listing set moved higher, likely reflecting a different mix of available buildings, unit sizes, and listing quality.
Mississauga was steady around $2,500 for most months and reached $2,650 in August month-to-date, although that August number is based on a smaller early-month sample. Brampton moved from $2,300 in January to $2,400 in July. Vaughan moved from $2,300 in January to $2,375 in July. Toronto moved from $2,500 in January to $2,550 in July, then sat at $2,500 in early August.
Some suburban markets softened in the monthly view. Oakville and Burlington were slightly lower in July than in January. Richmond Hill moved from $2,625 in January to $2,490 in July. Oshawa moved from $2,195 in February to $1,880 in July. These declines should be read as listing-market movement, not a prediction for every building or every lease. Smaller markets can shift when the mix of available listings changes.
For renters, the main lesson is to compare like with like and to compare within the same month when possible. A two-bedroom condo in Toronto in July 2026 had a different benchmark from a two-bedroom in Mississauga, Vaughan, or Oshawa in July 2026. A renter who can search across several GTA cities may find meaningful savings, but the best value depends on transit, commute, parking, building amenities, school needs, and how quickly a lease is needed.
For landlords and realtors, the data points in the opposite direction: price positioning should not rely on one broad GTA rent number. A one-bedroom in Vaughan, a two-bedroom in Markham, a three-bedroom in Oakville, and a studio in downtown Toronto each compete in a different segment and a different seasonal window. The most useful comparable set is filtered by city, month, property type, bedroom count, building age, parking, amenities, and recent listing activity.
Browse current Toronto rentals on Casakibo's Toronto rental hub: Toronto rentals on Casakibo
Compare live GTA rental listings from the Casakibo homepage: the Casakibo homepage
Explore Mississauga rentals: Mississauga rentals on Casakibo
Explore Vaughan rentals: Vaughan rentals on Casakibo
Explore Markham rentals: Markham rentals on Casakibo
Explore Oakville rentals: Oakville rentals on Casakibo
The Casakibo Data Labs prepare rental-market research using structured listing data, city-level comparisons, and neighbourhood-level market checks. This report was prepared by the Casakibo Data Labs using thousands of active residential lease listings from participating Canadian real estate boards and CREA member feeds. For data questions, market research, or partnership inquiries, contact Casakibo here: contact Casakibo