

Burnaby is Metro Vancouver’s clearest two-price city after Vancouver itself. Current sale listings have a $869,950 median. That number is almost polite. It is also misleading. From June through mid-September, condo/apartment listings had a $649,900 median and detached homes had a $1,999,000 median.
The monthly citywide line bounced because the mix bounced. January printed $988,500. February dropped to $799,900. Most later months lived in the $800,000s. A $150,000 swing in the headline can be a mix shift, not a Burnaby-wide markdown.
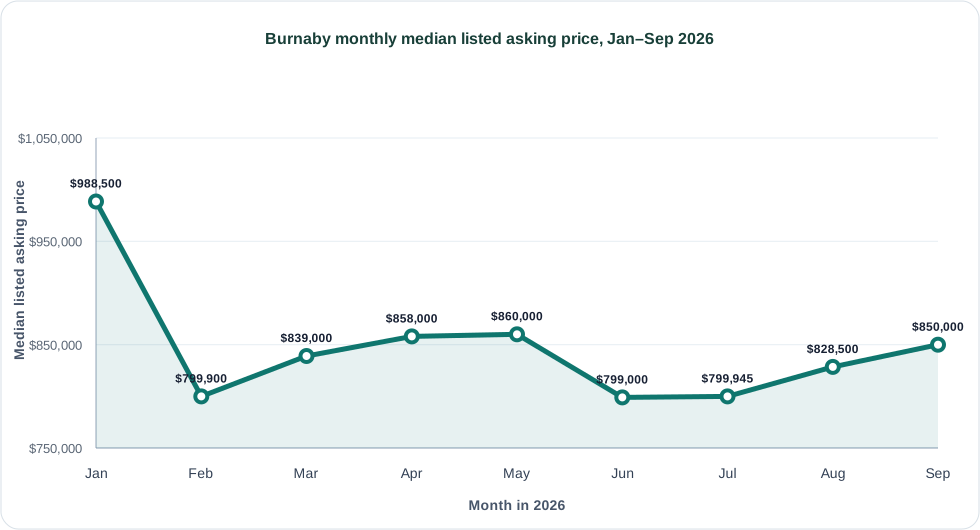
Burnaby monthly median listed asking price:
| Month | Sale listings | Median listed asking price |
|---|---|---|
| January 2026 | 332 | $988,500 |
| February 2026 | 365 | $799,900 |
| March 2026 | 668 | $839,000 |
| April 2026 | 719 | $858,000 |
| May 2026 | 688 | $860,000 |
| June 2026 | 700 | $799,000 |
| July 2026 | 608 | $799,945 |
| August 2026 | 544 | $828,500 |
| September 2026 (partial) | 407 | $850,000 |
Townhomes, at $899,000 in the June–September window, are the bridge. They do not close the gap. The detached premium over condos is still about $1.35 million. That is the number that should decide whether you are shopping Burnaby condos or Burnaby houses.
| June–September 2026 home type | Sale listings | Median listed asking price |
|---|---|---|
| Condo/apartment | 1218 | $649,900 |
| Townhome | 282 | $899,000 |
| Detached | 460 | $1,999,000 |
The listing counts make the polite citywide median possible. From June through mid-September, Burnaby had 1,218 condo sale listings and 460 detached listings. Condos outnumber houses by a wide margin, so the $869,950 current median is a condo-weighted number. The $1,999,000 detached median is the other Burnaby. Shoppers who hear “Burnaby is cheaper than Vancouver” are often hearing the condo side of that sentence.
Vancouver’s own condo median in the same window was $778,000, so Burnaby’s $649,900 condo lane is a real discount. The detached lane is not. At $1,999,000 versus Vancouver’s $2,496,000, you are still in a two-million-dollar house market. Read this with the Vancouver home-price report and the Richmond $1 million report if you are trying to pick a Metro Vancouver city rather than a home type.
Compare Burnaby homes for sale with Vancouver and Richmond, or read the Metro Vancouver rental trends report if renting is the backup plan.
The Casakibo Data Labs prepare market reports using structured Canadian real estate listing data, city-level comparisons, and property-type checks. This report was prepared by the Casakibo Data Labs using residential sale listings from participating Canadian real estate boards and CREA member feeds, covering January 1, 2026 through September 17, 2026. September is a partial month. For data questions, market research, or partnership inquiries, contact Casakibo.