

If you only glanced at Toronto’s spring asking prices, September would look like a different city. Toronto sale listings had a $849,900 median in May, then drifted down to $750,000 in August. In the first half of September the median jumped to $859,000. That is not a promise that every home got more expensive overnight. It is a reminder that Toronto’s citywide number moves when the mix of condos and houses changes, and that late-summer listings were cheaper than the new fall wave.
This report uses Toronto residential sale listings from January 1, 2026 through September 17, 2026. January opened at $710,000. The spring peak was May. August was the softest full month. September is partial, but the rebound is large enough to matter for anyone shopping now.
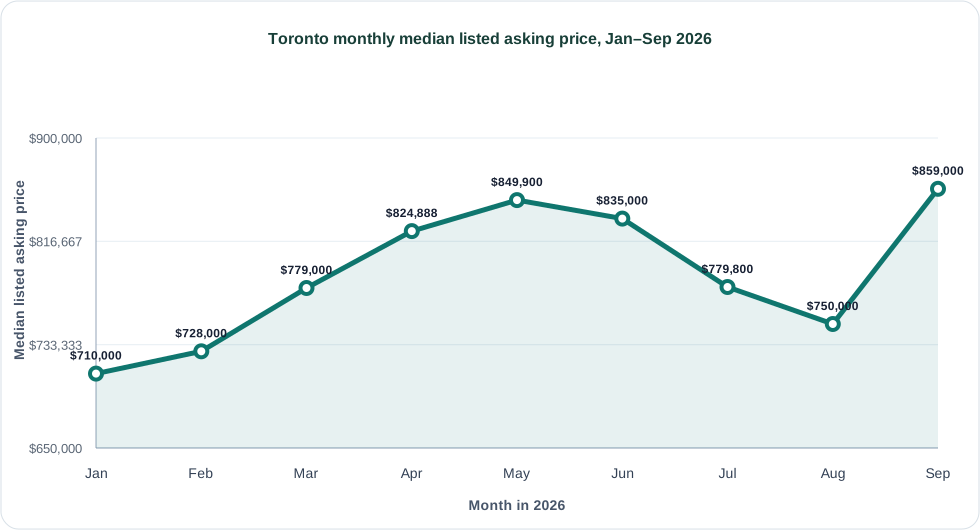
Toronto monthly median listed asking price:
| Month | Sale listings | Median listed asking price |
|---|---|---|
| January 2026 | 1396 | $710,000 |
| February 2026 | 2025 | $728,000 |
| March 2026 | 4287 | $779,000 |
| April 2026 | 5453 | $824,888 |
| May 2026 | 5709 | $849,900 |
| June 2026 | 5326 | $835,000 |
| July 2026 | 4513 | $779,800 |
| August 2026 | 3802 | $750,000 |
| September 2026 (partial) | 3571 | $859,000 |
The citywide line still hides the real fork in the road. From June through mid-September, condo/apartment sale listings had a $579,000 median, townhomes sat at $785,000, and detached homes were $1,280,000. A buyer using the $779,900 live-listing median as a budget is standing between those two worlds.
| June–September 2026 home type | Sale listings | Median listed asking price |
|---|---|---|
| Condo/apartment | 8088 | $579,000 |
| Townhome | 1604 | $785,000 |
| Detached | 6052 | $1,280,000 |
Volume is part of the same story. May had 5,709 sale listings, the busiest month in this window. August brought 3,802. Mid-September was already at 3,571 listings with half the month still open. A quieter August with a cheaper mix, then a busier fall with more houses in the sample, can move the median without every seller rewriting their price. These figures are listed asking prices, not sold prices.
If you are renting in the city while you wait, the ownership split has a rental twin. Condo rents and house rents did not move as one market either. Read Toronto condo rent trends beside Toronto house rental trends, then come back to the sale list with a home-type filter on.
The consumer takeaway is simple: do not read August’s dip as “Toronto got cheap,” and do not read September’s jump as “the boom is back.” Read the home type first. Browse current Toronto homes for sale, compare neighbourhood context in our Toronto neighbourhood report, or start from the Casakibo homepage.
The Casakibo Data Labs prepare market reports using structured Canadian real estate listing data, city-level comparisons, and property-type checks. This report was prepared by the Casakibo Data Labs using residential sale listings from participating Canadian real estate boards and CREA member feeds, covering January 1, 2026 through September 17, 2026. September is a partial month. For data questions, market research, or partnership inquiries, contact Casakibo.