
Burlington is the GTA city that spent 2026 almost at $1 million and not quite there. January sale listings had a $899,000 median. May reached $999,000. Mid-September printed $999,900. Current listings are $939,000, with 42.1% already asking $1 million or more.
Compared with 2025’s $844,450 median, 2026 through mid-September was $950,000. Burlington moved toward the round number. It did not take up residence the way Oakville did.
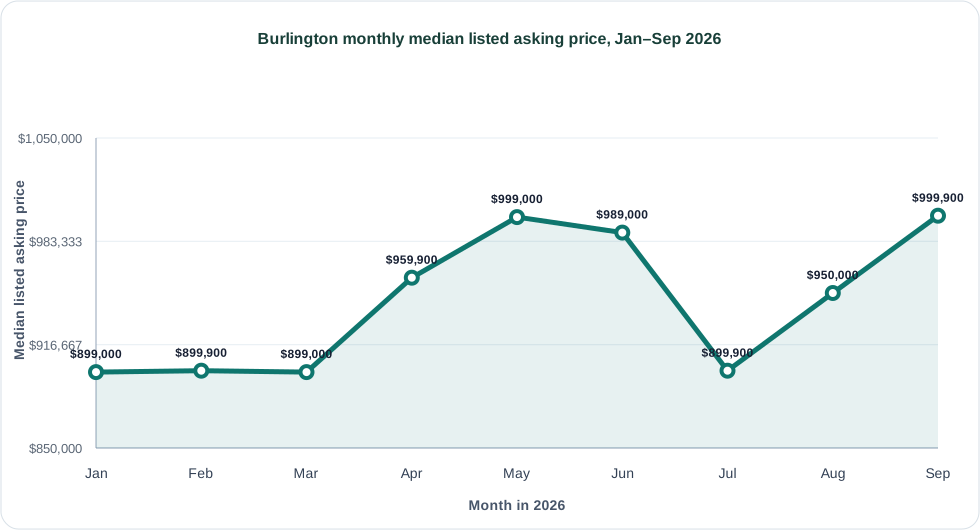
Burlington monthly median listed asking price:
| Month | Sale listings | Median listed asking price |
|---|---|---|
| January 2026 | 173 | $899,000 |
| February 2026 | 262 | $899,900 |
| March 2026 | 616 | $899,000 |
| April 2026 | 809 | $959,900 |
| May 2026 | 880 | $999,000 |
| June 2026 | 745 | $989,000 |
| July 2026 | 597 | $899,900 |
| August 2026 | 567 | $950,000 |
| September 2026 (partial) | 432 | $999,900 |
Detached listings were not waiting for the citywide median. June through mid-September detached homes had a $1,299,000 median. Condos were $566,500. Townhomes were $799,900. The “almost $1 million” story is a mix story. The house story is already over the line.
| June–September 2026 home type | Sale listings | Median listed asking price |
|---|---|---|
| Condo/apartment | 528 | $566,500 |
| Townhome | 550 | $799,900 |
| Detached | 1164 | $1,299,000 |
July is the month that keeps Burlington from being labelled a million-dollar city. The median dropped to $899,900 after May’s $999,000, then climbed back to $999,900 by mid-September. Current listings are $939,000. That is a city hovering, not a city that settled. Oakville, immediately east, already has two-thirds of listings over $1 million. Hamilton, immediately west, is still a $699,000 asking-price city. Burlington is the in-between shore.
For a house hunter, the in-between story is already over. The detached median of $1,299,000 is Oakville-adjacent. The condo median of $566,500 is the product that keeps the citywide line under $1 million. If you are choosing along the lake, read this beside the Oakville sale report and the Hamilton sale report rather than using one Halton-Hamilton average.
See Burlington homes for sale, compare Oakville and Hamilton, or read the Hamilton rental report if you are choosing between owning here and renting next door.
The Casakibo Data Labs prepare market reports using structured Canadian real estate listing data, city-level comparisons, and property-type checks. This report was prepared by the Casakibo Data Labs using residential sale listings from participating Canadian real estate boards and CREA member feeds, covering January 1, 2026 through September 17, 2026. September is a partial month. For data questions, market research, or partnership inquiries, contact Casakibo.